Where Does Voya U.S. Short Duration High Income Fit in Investor Portfolios?

Time to read: Minutes

Our proven strategy can help diversify a fixed income allocation—providing a complement or alternative to full-market high yield and core bonds.

Use Voya U.S. Short Duration High Income as a complement or alternative to high yield

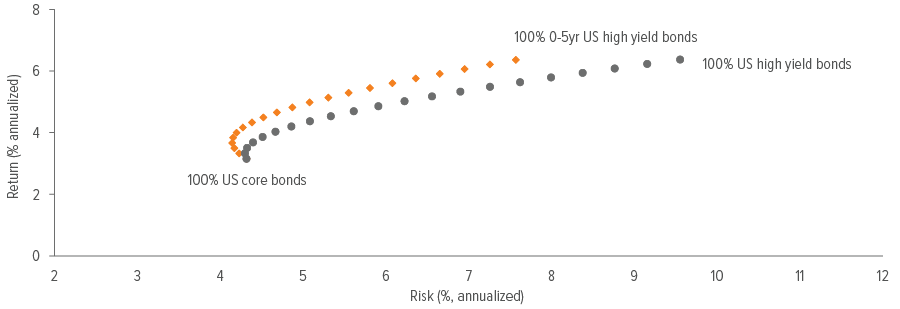
High yield bonds are often used to diversify fixed income allocations, and short duration high yield bonds have proven to be an effective tool in doing just that. This is because short duration high yield bonds have historically delivered comparable returns to full-market high yield but with less volatility, meaning they can be used to expand the efficient frontier of a fixed income portfolio (Exhibit 1).
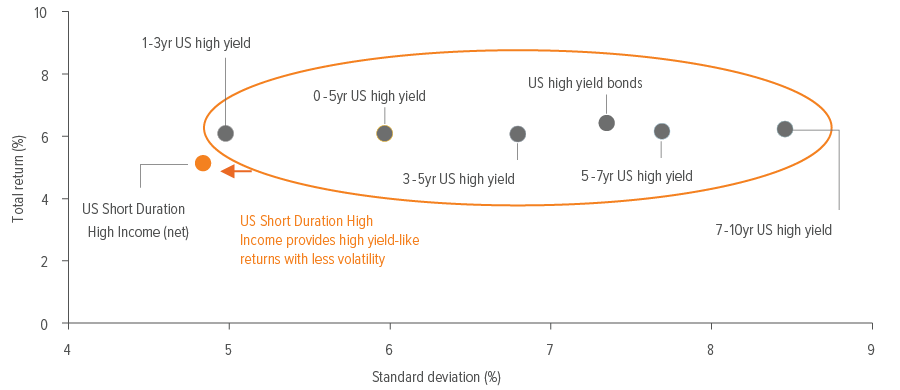
Voya U.S. Short Duration High Income has done a particularly good job of this over its history (Exhibit 2); as a result, it can be used to complement (or even replace) an allocation to full-market high yield. The Strategy has a lower beta to the high yield market, potentially enhancing portfolio diversification by offering a narrower range of annual returns and providing an asymmetric return profile.

Exhibit 1: Adding short duration high yield bonds increases returns and lowers volatility
Dec 2006 – Jun 2024
Exhibit 1: Adding short duration high yield bonds increases returns and lowers volatility
Exhibit 2: Voya U.S. Short Duration High Income provides high-yield-like returns with less volatility
Nov 2009 – Jun 2024
Voya U.S. Short Duration High Income provides high-yield-like returns with less volatility

As of 06/30/24. Source: Voya IM, FactSet, ICE Data Services, Morningstar. Past performance is not indicative of future results. This statement reflects performance and characteristics for the time period shown; results over a different time period may have been more or less favorable. See index associations and additional disclosures at the end of this document. Investors cannot invest directly in an index. Index returns are presented as net returns, which reflect both price performance and income from dividend payments, if any, but do not reflect fees, brokerage commissions or other expenses of investing. For Exhibit 2, the data above is supplemental information to the U.S. Short Duration High Income GIPS-compliant composite table at the end of this document. Composite performance inception date: 11/01/09. The Composite represents the investment results of a group of fully discretionary portfolios managed according to the Strategy.

Use Voya U.S. Short Duration High Income as a complement or alternative to core bonds

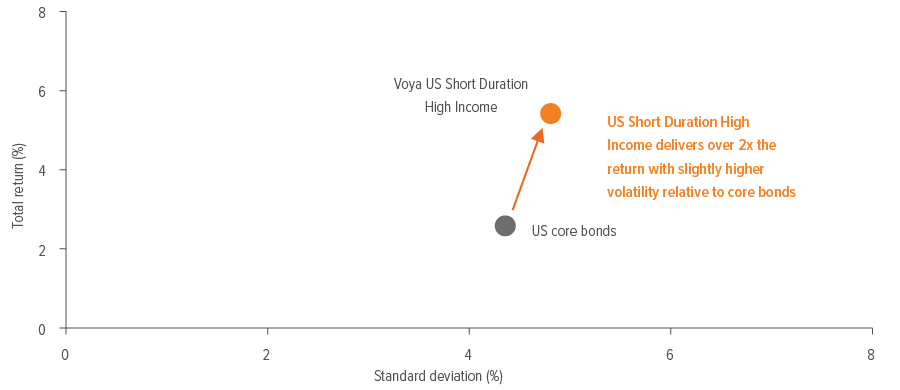
Like they do with full-market high yield, short duration high yield bonds can increase returns and lower volatility relative to core bonds. The Strategy has historically provided consistent income and strong risk-adjusted performance compared with core bonds overall, resulting in greater returns with similar volatility (Exhibit 3).

Furthermore, Voya U.S. Short Duration High Income has proven to be a good complement to a core fixed income allocation (Exhibit 4). Its low correlation to core bonds helps diminish the magnitude of negative performance outcomes and reduces overall volatility—all while enhancing returns and improving positioning with a higher yield and a lower duration.
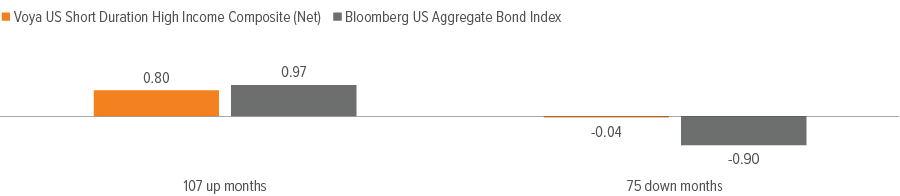
Exhibit 3: Voya U.S. Short Duration High Income can be used as a fixed income diversifier
Nov 2009 – Jun 2024
Exhibit 3: Voya U.S. Short Duration High Income can be used as a fixed income diversifier
Exhibit 4: The Strategy complements core bonds, capturing much of the upside with significantly less downside
Nov 2009 – June 2024 (average monthly returns, %)
Exhibit 4: The Strategy complements core bonds, capturing much of the upside with significantly less downside

As of 06/30/24. Source: Voya IM, FactSet, ICE Data Services, Morningstar. Past performance is not indicative of future results. This statement reflects performance and characteristics for the time period shown; results over a different time period may have been more or less favorable. The data above is supplemental information to the U.S. Short Duration High Income GIPS-compliant composite table at the end of this document. Composite performance inception date: 11/01/09. The Composite represents the investment results of a group of fully discretionary portfolios managed according to the Strategy. See index associations and additional disclosures at the end of this document. Investors cannot invest directly in an index. Index returns are presented as net returns, which reflect both price performance and income from dividend payments, if any, but do not reflect fees, brokerage commissions or other expenses of investing. For Exhibit 4, market participation is based on the average of monthly returns in up and down markets as determined by the respective index.

Voya U.S. Short Duration High Income: A history of strong performance

The Voya U.S. Short Duration High Income Strategy has historically provided consistent income and strong risk-adjusted performance, outperformed core bonds with similar volatility, and delivered broad high yield bond market returns with less volatility.
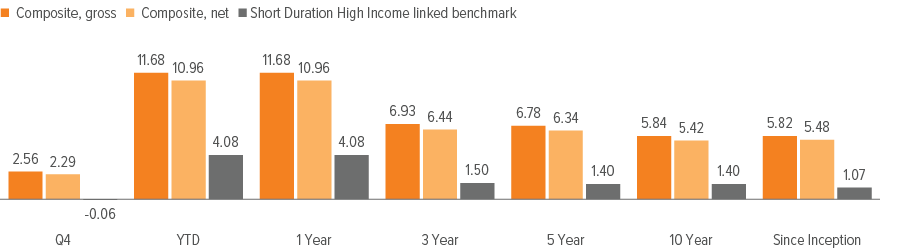
Voya U.S. Short Duration High Income Composite performance: annualized

As of 06/30/24. Source: Voya IM, ICE Data Services. Past performance is not indicative of future results. Composite performance inception date: 11/01/09. The Composite represents the investment results of a group of fully discretionary portfolios managed according to the Strategy. Market participation is based on the average of monthly returns in up and down markets as determined by the respective index. Composite market participation is supplemental information to the U.S. Short Duration High Income GIPS-compliant composite presentation at the end of this document. See index associations and additional disclosures at the end of this document.

Voya U.S. Short Duration High Income Composite
Schedule of composite performance results as of December 31, 2023
Voya U.S. Short Duration High Income Composite

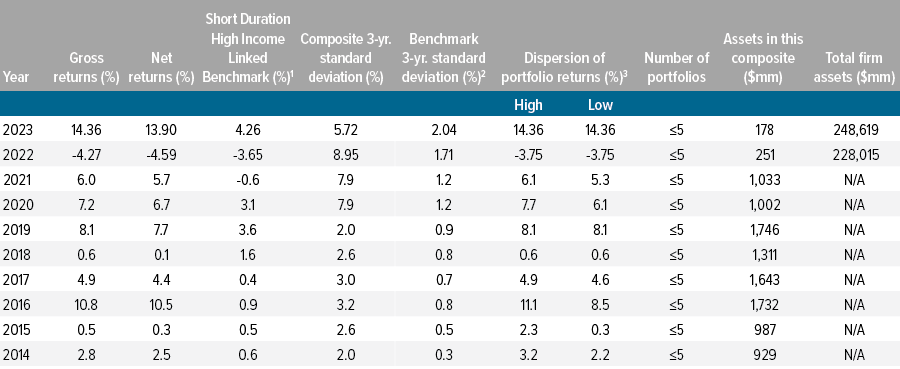
1 The Barclays 9-12 Treasury Index returns through December 31, 2013 and the ICE BofA 1-3 Year US Treasury Index from January 1, 2014 forward, which do not reflect the deduction of investment fees, have been provided for comparison purposes and have not been examined by independent accountants. 

2 “Composite 3-Yr St Dev” and “Benchmark 3-Yr St Dev” are rolling 3-year standard deviation calculations, which measure the variability of the gross-of-fee monthly performance returns for the composite and benchmark index over the preceding 36-month period on an annualized basis. If the composite has not been in existence for at least 3 years as of a particular year-end then “N/A” will be displayed. 

3 “Dispersion of Portfolio Returns” presented for each annual period is based on gross-of-fees returns and is equal to the highest and lowest annual return among the portfolios that are included in the composite for the full year. If there is not at least 1 account that was in the composite for the entire year, then “N/A” will be displayed.

A note about risk

Debt instruments: Debt instruments are subject to greater levels of credit and liquidity risk, may be speculative, and may decline in value due to changes in interest rates or an issuer’s or counterparty’s deterioration or default. High yield fixed income securities: There is a greater risk of issuer default, less liquidity, and increased price volatility related to high yield securities than investment grade securities. Market volatility: The value of the securities in the portfolio may go up or down in response to the prospects of individual companies and/or general economic conditions. Price changes may be short or long term. Local, regional or global events such as war, acts of terrorism, the spread of infectious illness or other public health issues, recessions, or other events could have a significant impact on the portfolio and its investments, including hampering the ability of the portfolio’s manager(s) to invest the portfolio’s assets as intended. Issuer risk: The portfolio will be affected by factors specific to the issuers of securities and other instruments in which the portfolio invests, including actual or perceived changes in the financial condition or business prospects of such issuers. Interest rate risk: The values of debt instruments may rise or fall in response to changes in interest rates, and this risk may be enhanced for securities with longer maturities. Credit risk: If the issuer of a debt instrument fails to pay interest or principal in a timely manner, or negative perceptions exist in the market of the issuer’s ability to make such payments, the price of the security may decline.

3827591

Voya U.S. Short Duration High Income GIPS disclosure

The Firm: Voya Investment Management (the "Firm") is defined as all investment portfolios managed by Voya Investment Management Co. LLC and its subsidiary Voya Investment Trust Co. The firm claims compliance with the Global Investment Performance Standards (GIPS®) and has prepared and presented this report in compliance with the GIPS standards. Voya Investment Management has been independently verified for the periods January 1, 1996, through December 31, 2022. The verification reports are available upon request. A firm that claims compliance with the GIPS standards must establish policies and procedures for complying with all the applicable requirements of the GIPS standards. Verification provides assurance on whether the firm’s policies and procedures related to composite and pooled fund maintenance, as well as the calculation, presentation, and distribution of performance, have been designed in compliance with the GIPS standards and have been implemented on a firm- wide basis. Verification does not provide assurance on the accuracy of any specific performance report. 

As of July 2022, Voya Investment Management acquired the investment personnel and assets related to this composite from Allianz Global Investors. The historical performance presented here thus became that of Voya Investment Management from that point forward, after meeting the portability requirements of the Global Investment Performance Standards. As a result of this change, the historical amounts listed under Total Firm Assets have been removed from the chart above. 

Policies for valuing investments, calculating performance, and preparing GIPS reports are available upon request. A list of composite and limited distribution pooled fund descriptions and a list of broad distribution pooled funds are available upon request. 

GIPS® is a registered trademark of CFA Institute. CFA Institute does not endorse or promote this organization, nor does it warrant the accuracy or quality of the content contained herein.

The Composite: The US Short Duration High Income Composite (the “Composite”) includes those portfolios with investment guidelines mandating weighted average portfolio durations of 3 years or less. Portfolio holdings will be centered on highly liquid bonds rated from B3, B- through Baa1, BBB+. Emphasis is placed on bonds with a high likelihood of being called or maturing within 2 years. Issuer Portfolios may include, without restriction, convertible bonds, zero coupons and Yankees, and as of January 1, 2015, to include bank loans. These portfolios are generally opportunistic and may hold large cash or Treasury positions. All Short Duration High Income portfolios are managed for total return and measured against a client specific benchmark, generally referencing the 1-year Treasury. 

The Composite was created and incepted on November 1, 2009. The Composite includes all actual fee paying discretionary institutional and mutual fund accounts (including sub-advisory relationships) with comparable investment objectives and risks, managed by the firm for at least one full month. 

Effective January 1, 2015 the minimum account size for inclusion in the composite has been removed. Prior to this there was a minimum account size of $5 million for inclusion in the Composite. In the event of a significant cash flow to an account which is defined by the firm’s policies and procedures as 25% or more of the beginning market value, the account will be removed from composite for one full month. Additional information regarding the treatment of significant cash flows is available upon request. As of January 1, 2016, the significant cash flow policy has been removed globally. 

The Composite includes one mutual fund for which the firm is the sub advisor. The gross and net returns for the mutual fund assume reinvestment of distributions. Returns are calculated based on the change in net asset value of the Institutional share class. Gross return is arrived at by adding back the annual expense ratio of the Institutional Class to the change in NAV calculation. Net return is arrived at by deducting the management fee paid to the firm as a sub advisor and is gross of administrative fees. From time to time, when observable inputs and prices are not available or appropriate for a security in a portfolio, the Firm will make a fair market value determination for such security based on the best information available under the circumstances.

Portfolio Returns: Returns are calculated on a total return basis, including all dividends and interest, accrued income, realized and unrealized gains or losses, and are net of all brokerage commissions, execution costs and without provision for federal or state income taxes. Returns are net of any foreign withholding taxes on dividends, interest and earnings. Returns presented are time-weighted returns. Performance results are expressed in U.S. dollars. 

Fees: Performance results stated to be “gross” do not reflect the deduction of investment advisory fees. Gross performance results earned on behalf of the firm’s clients will be reduced by the firm’s advisory fees. Net performance results, which are calculated by reducing the composite gross return by the weighted average management fee charged to the portfolios in the composite, are also displayed. The firm investment advisory fees are usually accrued monthly based on the market value of the assets in a portfolio, including cash or its equivalent, held for investment, at the end of each month. The standard advisory fees for this composite strategy, as reported in Form ADV Part 2A Brochure for the investment style described herein, are 0.50% annually on the first $50M, 0.45% on the next $50M; and negotiable thereafter. Please refer to the firm Form ADV Part 2A Brochure for the most current fee schedule now in effect.

Index: The ICE BofA 1-3 Year US Treasury Index is an unmanaged index that tracks the performance of the direct sovereign debt of the U.S. Government having a maturity of at least one year and less than three years. The Barclays 9-12 Month U.S. Treasury Index includes public obligations of the U.S. Treasury with a remaining maturity of 9-12 months. The unmanaged market index is provided to represent the investment environment existing during the time periods shown. For comparison purposes, the index is a fully invested index (i.e. includes reinvestments of income) and does not include any transaction costs, management fees, or other costs. From November 1, 2009 through December 31, 2013 Barclays 9-12 Month U.S. Treasury Index was the benchmark. Beginning January 1, 2014, the ICE BofA (formerly known as BAML) 1-3 Year US Treasury Index became the benchmark reported for comparison purposes. The benchmark was changed to more accurately reflect the composite strategy. Investors may not make direct investments into any index. All returns presented are calculated using U.S. dollars. The portfolios within this composite may and do invest in non-benchmark securities. Further information is available upon request.

Internal Dispersion: "Dispersion of Portfolio Returns" presented for each annual period is based on gross-of-fees returns and is equal to the highest and lowest annual return among the portfolios that are included in the composite for the full year. If there is not at least 1 account that was in the composite for the entire year, then “N/A” will be displayed.

Past performance is not indicative of future results. Gross returns do not give effect to investment advisory fees, which would reduce such returns. Investment advisory fees are described further in Form ADV Part 2A Brochure of the investment adviser. Advisory fees deducted periodically from accounts can have an impact on performance. As an example, the effect of investment advisory fees on the total value of a portfolio assuming (1) $1,000,000 investment, (2) portfolio return of 5% per year, and (3) 1.00% annual investment advisory fee would be $10,268.81 in the first year, $56,741.68 over five years, and $129,160.05 over ten years. Actual fees charged may vary by portfolio due to various conditions, including account size. The net-of fee results for individual accounts and for different time periods may vary. Unless otherwise noted, equity index performance is calculated with gross dividends reinvested and estimated tax withheld, and bond index performance includes all payments to bondholders, if any. Indexes are referred to for comparative purposes only and are not intended to parallel the risk or investment style of the portfolios in the Composite. Indexes do not utilize leverage. Index calculations do not reflect fees, brokerage commissions or other expenses of investing. Investors may not make direct investments into any index. Index data contained herein (and all trademarks related thereto) are owned by the indicated index provider and may not be redistributed. The information herein has not been approved by the index provider.

Important information 

An investor cannot invest directly in an index, and index performance does not reflect the deduction of any fees, expenses or taxes. Index comparisons have limitations, as volatility and other characteristics may differ from a particular investment. Index associations: 1-3 year U.S. high yield: ICE BofA 1-3 Year U.S. Cash Pay High Yield Index; 3-5 year U.S. high yield: ICE BofA 3-5 Year U.S. Cash Pay High Yield Index; 5-7 year U.S. high yield: ICE BofA 5-7 Year U.S. Cash Pay High Yield Index; 7-10 year U.S. high yield: ICE BofA 7-10 Year U.S. Cash Pay High Yield Index; U.S. high yield bonds: ICE BofA U.S. High Yield Index; 0-5 year U.S. high yield: ICE BofA 0-5 Year U.S. High Yield Constrained Index; U.S. core bonds: Bloomberg U.S. Aggregate Bond Index. 

Index definitions: The Bloomberg U.S. Aggregate Bond Index is a broad-based flagship benchmark that measures the investment grade, U.S. dollar-denominated, fixed-rate taxable bond market. The index includes Treasuries, government-related and corporate securities, fixed-rate agency MBS, ABS and CMBS (agency and non-agency). The ICE BofA U.S. High Yield Index is a market-value-weighted index consisting of USD-denominated, non-investment-grade bonds not currently in default.

Past performance does not guarantee future results. This market insight has been prepared by Voya Investment Management for informational purposes. Nothing contained herein should be construed as (i) an offer to sell or solicitation of an offer to buy any security or (ii) a recommendation as to the advisability of investing in, purchasing or selling any security. Any opinions expressed herein reflect our judgment and are subject to change. Certain statements contained herein may represent future expectations or other forward-looking statements that are based on management’s current views and assumptions and involve known and unknown risks and uncertainties that could cause actual results, performance or events to differ materially from those expressed or implied in such statements. Actual results, performance or events may differ materially from those in such statements due to, without limitation, (1) general economic conditions, (2) performance of financial markets, (3) interest rate levels, (4) increasing levels of loan defaults, (5) changes in laws and regulations and (6) changes in the policies of governments and/or regulatory authorities. The opinions, views and information expressed in this commentary regarding holdings are subject to change without notice. The information provided regarding holdings is not a recommendation to buy or sell any security. Fund holdings are fluid and are subject to daily change based on market conditions and other factors. For use by qualified institutional investors and financial professionals only. Not for inspection by, distribution to or quotation to the general public.

Top