Win Big or Win Often: Which Matters More?

Portfolio Manager and Co-Head of Fundamental Research

Head of Fundamental Analytics

Key Takeaways
Excess capital yield, a proprietary Voya metric, measures the dry powder that management teams have available to generate shareholder value.
Using the ECY framework, analysts identify stocks with ample excess capital and management teams that are likely to deploy it well.
ECY in the hands of skilled analysts is a potent combination proven to drive alpha.
Screening for high levels of excess capital is a good starting point for finding winners—but persistent stock picking comes from fundamental analysis to identify companies that best use their dry powder.
Excess capital yield offers a window into value creation
Voya’s value equity strategies employ a proprietary framework we call excess capital yield (ECY). In our experience, this approach provides a more holistic, forward-looking view of a company’s capacity to generate shareholder value, compared with conventional, backward-looking value metrics.
ECY takes into account a company’s cash, free cash flow, dividend payouts and balance sheet optimization (Exhibit 1). These components represent the levers a company has to drive value—not just through dividends, but also in terms of share buybacks, accretive acquisitions and internal investments.

Source: Voya IM.
On its own, the ECY metric carries valuable information: The more excess capital a company has to work with, the more value it can create—at least on paper. In reality, plenty of companies primed for success squander away capital through poor decisions, such as an ill-advised merger. Conversely, companies with talented leadership can take a challenging situation and turn it into a success story.
For this reason, our ECY framework doesn’t rely solely on a raw calculation. Instead, ECY sparks a deeper analysis of a company’s balance sheet, sales projections and potential earnings power, as well as the prowess of its management team. This qualitative insight helps us select a higher-quality pool of stocks which may be capable of generating additional expected returns.
Is it possible to quantify the value from fundamental analysis? We’re glad you asked …
Making a good thing better
The best portfolio managers are the ones who pick the most winners, right? Actually, no.
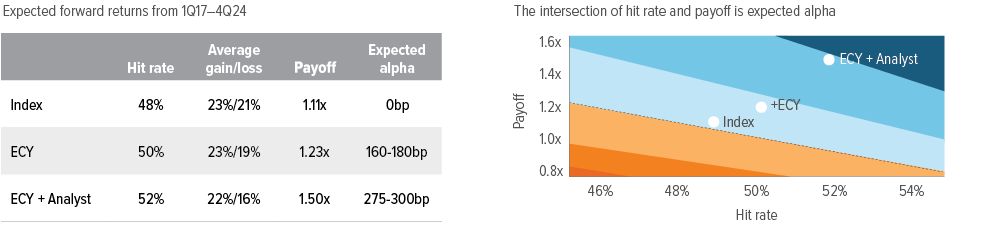
Of course, having a high hit rate on stock picks is desirable, but alpha also depends on the “payoff.” The payoff is the ratio of the winners’ average gain to the losers’ average loss. A payoff of greater than 1.0x signals that a portfolio made more on its winners than it lost on its losers. A manager with a modestly lower hit rate can still generate outperformance if their payoff is sufficiently high.
The illustration below demonstrates the relationship between hit rate and payoff and the subsequent expected excess return (alpha). Our analysis is based on monthly returns from 12/30/16 (the inception of our ECY framework) through 09/30/23, applied to three portfolios:
- Index: Russell 1000 Value Index, representing the opportunity set
- ECY: Top third of stocks in the index based on ECY screen
- ECY+analyst: Top third of ECY analyst picks
Key termsHit rate: % of picks that outperformed the index Average gain/loss: Average return among the outperformers/underperformers Payoff: Ratio of average gain of winners to the absolute value of the average loss of losers Expected alpha: Geometric average of monthly expected returns based on hit rate and payoff |
Over the period, the index had a hit rate of 48% (less than half of the stocks outperformed their sector’s cap-weighted return), but its average gain of 23% exceeded its average loss of 21%, producing a payoff of 1.11x (Exhibit 2). The index’s low hit rate negated its payoff, resulting in an expected excess return of zero—which makes sense for a passive universe of stocks.
The ECY portfolio (with no analyst input) achieved a marginally higher hit rate (50% versus 48%) and payoff (1.23x versus 1.11x, driven by lower average losses). Together, these characteristics led to expected alpha of 160-180bp.

As of 12/31/25. Source: Voya IM. For illustrative purposes only. Performance displayed is not for an investable strategy. The data presented above is derived from a monthly back test from 12/30/16 through 12/31/24 which is the period of ECY implementation. The universe is equally weighted and comprises Russell 1000 Value constituents, excluding the Utilities and Real Estate sectors. Performance statistics are calculated monthly and then aggregated over the entire period. The return horizon for this analysis is one year forward, aligning with the intended holding period of the strategy.
Improving performance through fundamental analysis
With the benefit of fundamental analysis, the hit rate rose to an impressive 52% for the ECY+analyst portfolio. In addition, while our ECY+analyst framework produced similar gains, its losers were more limited, and the wider spread between gains and losses skewed the portfolio towards an even higher payoff. The ability of the ECY+analyst portfolio to pick more winners (52%) with a higher average gain-to-loss ratio (1.50x) produced a greater expected alpha of 275-300bp over the index (Exhibit 3).
For illustrative purposes only. Performance displayed is not for an investable strategy. The data presented above is derived from a monthly backtest from 12/30/16 to 12/31/24. The universe is equally weighted and comprises Russell 1000 Value constituents, excluding the Utilities and Real Estate sectors. Performance statistics are calculated monthly and then aggregated over the entire period. These statistics include: Hit Rate: Percentage of stocks outperforming the equal-weighted universe. Average Gain: Average excess return of outperforming stocks. Average Loss: Average excess return of underperforming stocks. Payoff: Ratio of average gain to the absolute value of average loss. Expected Alpha: Calculated as (Hit Rate x Average Gain) + [(1 - Hit Rate) x Average Loss]. The return horizon for this analysis is one year forward, aligning with the intended holding period of the strategy. This analysis is conducted for several groups of stocks: the entire universe, tertiles of Excess Capital Yield (ECY), and the overlap of ECY tertiles with portfolio holdings. The charts (from left to right) compare these statistics for: 1) The equal-weighted (passive) universe. 2) The universe with ECY applied. 3) The universe with both ECY and fundamental stock selection impacts applied. Source: Voya IM.
The bottom lineOur proprietary ECY framework provides our fundamental analysts with a solid starting point to thoroughly examine the sustainability of a company's capital generation as well as the management team's skill in deploying excess capital effectively. The marriage of this quant framework with fundamental analysis is a more effective way of delivering alpha. |
A note about risk
The principal risks are generally those attributable to investing in stocks and related derivative instruments. Holdings are subject to market, issuer and other risks, and their values may fluctuate. Market risk is the risk that securities or other instruments may decline in value due to factors affecting the securities markets or particular industries. Issuer risk is the risk that the value of a security or instrument may decline for reasons specific to the issuer, such as changes in its financial condition.
The Voya Large Cap Value Strategy employs a quantitative model to execute the strategy. Data imprecision, software or other technology malfunctions, programming inaccuracies and similar circumstances may impair the performance of these systems, which may negatively affect performance. Furthermore, there can be no assurance that the quantitative models used in managing the Strategy will perform as anticipated or enable the strategy to achieve its objective. Past performance does not guarantee future results. All investing involves risks of fluctuating prices and the uncertainties of rates of return and yield inherent in investing. All security transactions involve substantial risk of loss.