U.S. Investment Grade Bonds: Steady Amid Trade Turbulence

Head of U.S. Investment Grade Corporates

Key Takeaways
Gross supply in the investment grade (IG) market is expected to remain strong for the rest of 2025, with $900 billion issued in the first half, up 4.3% over the same period last year
Credit metrics in the IG market reflect healthy trends, with companies demonstrating conservative balance sheet management, modest debt growth, and low shareholder payouts, supporting their ability to weather a potential slowdown.
Sectors such as retailers and autos are particularly vulnerable to tariff policies due to their international supply chain exposure, while financials and utilities are better positioned to navigate potential trade war effects.
As uncertainty around U.S. trade policy continues to shape the landscape for risk assets, a complex picture emerges for investment grade credit in 2025—but what does the future hold?
Market review
Financial markets have experienced a notable increase in volatility in 2025, driven primarily by uncertainty over U.S. trade policy.
On April 2, the magnitude of the intended reciprocal tariffs and their potential economic impact shook markets. Equities declined sharply and credit spreads moved significantly wider in a short period of time.
However, the volatility was short-lived, as a 90-day “pause” was announced a week later, which raised hopes that potential trade deals could alleviate expected tariff rates between large trading partners. Furthermore, tension between the U.S. and China de-escalated following negotiations, as the worst-case scenario seemed to have been avoided.
Economic data continued to paint a positive picture, with inflation yet to see any meaningful impact from tariffs. As such, market participants began to shift focus toward the government’s debt situation and looming fiscal legislation, which resulted in a steeper yield curve. Despite the heightened volatility, fixed income spread sectors have broadly delivered positive returns this year due to lower overall Treasury yields (Exhibit 1).
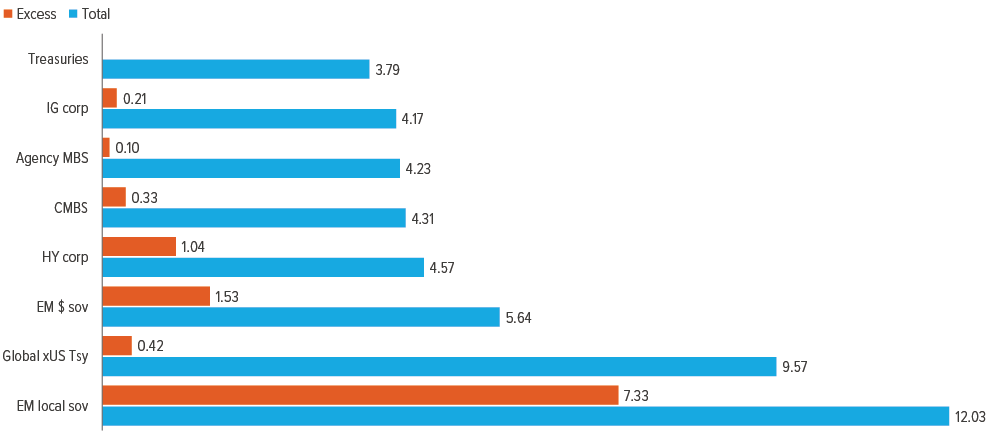
As of 06/30/25. Source: Bloomberg Index Services Limited, J.P. Morgan, Voya IM. Excess returns: EM $ sov is the spread return of the J.P. Morgan EMBI Global Diversified Index; EM local sov is the total return of the J.P. Morgan GBI-EM Global Diversified Index (Tax-Adjusted Local Return) less the total return of the Bloomberg U.S. Treasury 3-7 Year Index; all others represented by the excess return of the respective Bloomberg indexes. See endnotes for index definitions and additional disclosures.
IG credit spreads have been volatile given the macro noise and uncertainty
January and February traded in a relatively tight band, but investors required a higher risk premium in March due to the emergence of softer economic data. To top it off, volatility became even more prominent in April during the height of tariff uncertainty, which resulted in the option-adjusted spread (OAS) of the IG market reaching its widest point since 2023 at 119 bp.
With that said, IG spreads retraced a significant portion of the widening during late April as the tariff noise subsided. The recovery was also aided by a better-than-expected first-quarter earnings season and stable technicals on the back of healthy yield-based investor demand. While spreads don’t necessarily screen cheap, plenty of factors could keep them where they are in the near term. The main tailwinds include positive (albeit slowing) economic growth, healthy corporate earnings, supportive ratings trends, and low net supply.
Looking more closely at the subcategories within the IG market, total returns have been relatively uniform across A and BBB rated issuers for the YTD period— the former outperforming during the initial April selloff, and the latter benefiting during the subsequent recovery. In terms of sectors, financials have been a notable outperformer, underpinned by strong earnings. In contrast, the utilities space has lagged, although the bulk of the spread widening occurred in January due to the impact of the California wildfires. Across the credit curve, the front-end and intermediate segments have outpaced the long end given the steeper Treasury curve (Exhibit 2).
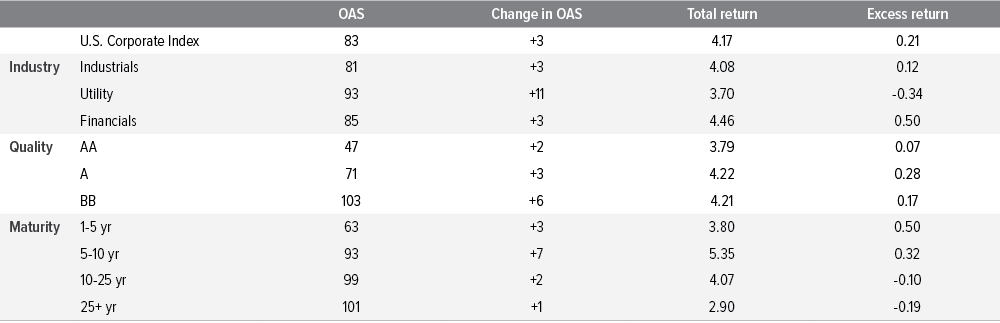
As of 06/30/25. Source: Barclays, Bloomberg. See endnotes for index definitions and additional disclosures.
Market outlook
We believe many of the same themes that shaped our projections at the start of the year will remain prevalent in the second half. Supportive technicals and healthy fundamentals should continue to underpin credit spreads. However, if the economy slows more than expected due to a trade war, the move wider in spreads will be cushioned by high starting yields, which remain well above their 10-year historical average (Exhibit 3). Furthermore, falling rates could boost returns, with the Fed expected to provide a buffer in the event of a more pronounced slowdown in economic activity.
We expect volatility to remain prominent, as potentially slower growth combined with the uncertainty of government policies will lead to episodic bouts of spread widening. This could present attractive opportunities for active managers to add risk.
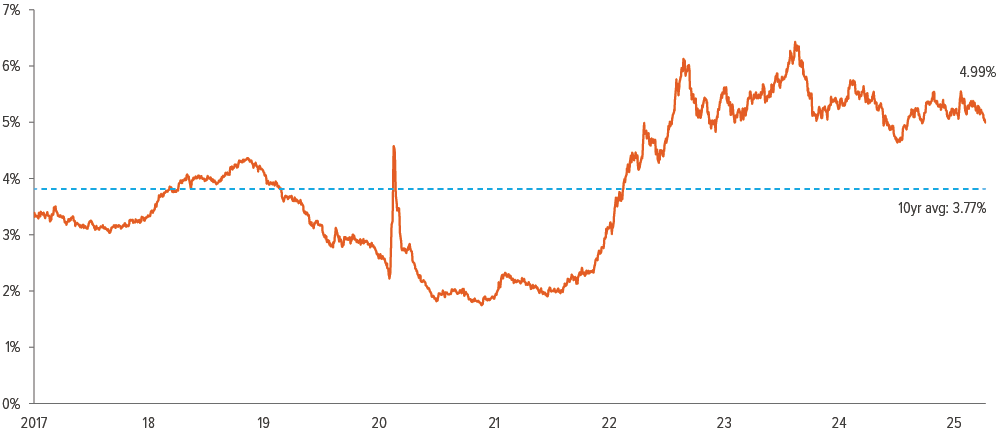
As of 06/30/25. Source: Barclays, Bloomberg. See endnotes for index definitions and additional disclosures.
Technicals should remain supportive, driven by investor flows and negative net supply
With the worst of the tariff risks in the rearview mirror, we believe technicals are likely to be the main driver of spreads for the rest of the year. Primary market activity has continued at a healthy clip this year, largely meeting our initial expectations even after the brief lull in April. For the YTD period through June, gross supply amounted to $900 billion, which is up 4.3% versus the comparable period in 2024 (Exhibit 4).
The use of proceeds has been relatively diversified across financial and non-financial issuers. However, persistently high rates have continued to curtail new M&A deal origination, as just 10% of total supply has supported M&A paper in 2025. Elevated maturities have muted net supply, and, combined with dealer balance sheets remaining close to 2019 lows, this has been supportive for spreads. Gross supply should remain strong for the balance of the year: Although the near-term maturity wall is sizable (on top of ongoing capex needs), we don’t foresee any meaningful return in M&A activity until 2026.
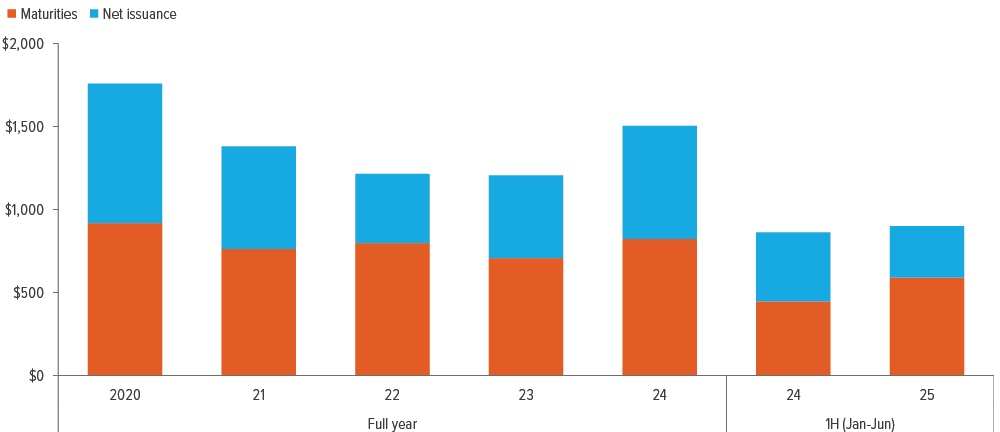
As of 06/30/25. Source: J.P. Morgan.
On the demand side—further adding to the positive technicals—is steady interest from yield-focused investors. While overall flows within mutual funds and ETFs are light compared with last year’s, the IG market has still seen steady demand in 2025, with institutional and foreign investors remaining a key buyer base. After negative retail flows in April following the spike in volatility, inflows picked up recently, with June seeing roughly $3.3 billion of weekly flows into the asset class. High yields and the prospect of a few rate cuts should keep appetite for U.S. corporate bonds elevated.
Fundamentals can weather a slowdown in growth
As we head into the second half of 2025, credit metrics in the IG market reflect healthy trends. Companies have demonstrated conservative balance sheet management, as evidenced by modest debt growth and low shareholder payouts.
On the earnings side, the recent quarterly print suggests strong momentum despite all the policy uncertainties heading into the quarter. Revenue growth was strong at 7% YoY (a seven-quarter high, according to J.P. Morgan Research), which is similarly reflected in EBITDA growth at 8.2% YoY (both ex-commodities). Earnings have been led by the tech space, while cyclicals have lagged.
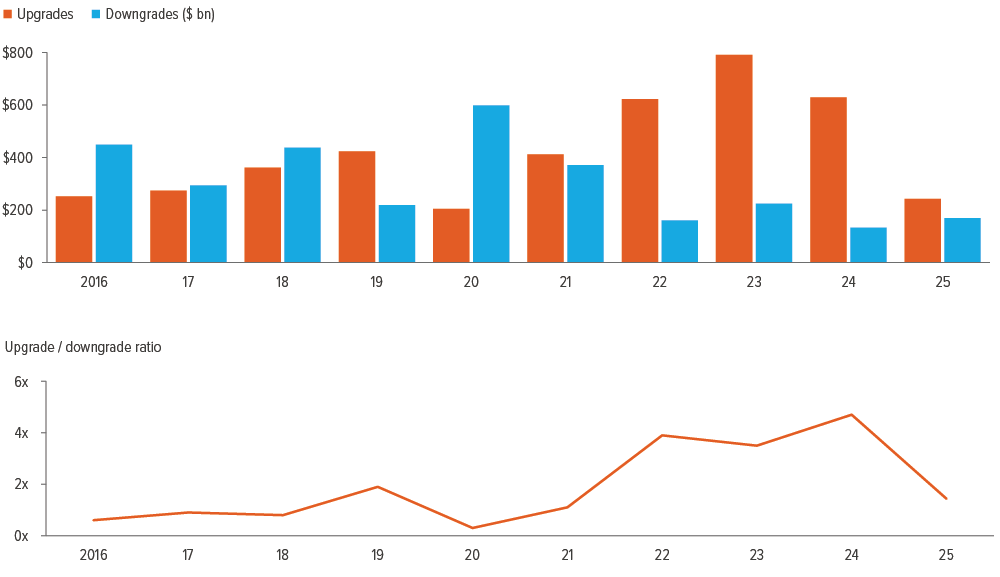
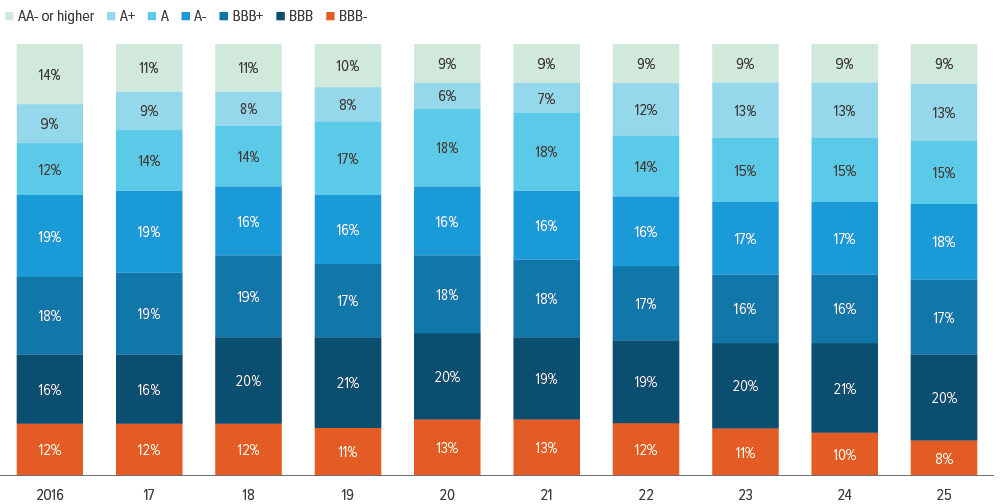
Meanwhile, positive ratings momentum has decelerated, as the pace of upgrades has slowed recently. Although the upgrade/downgrade ratio remains positive, it has fallen below 2x for the first time since 2021 after averaging around 4x in the last 3 years (Exhibit 5). Still, the rating composition of the IG market remains robust, as the BBB- share is at a record low of just 8%. In addition, the list of “fallen angel” candidates remains short.
Interest coverage ratios weakened over the past year as companies refinanced low-coupon debt at higher rates. However, the pace of deterioration slowed in the last quarter and may see further reprieve once the Fed delivers additional rate cuts. Importantly, we believe companies are positioned well heading into a potentially slower-growth environment, and we don’t expect corporate fundamentals to be a driver of spreads in the medium term.
Tariff policy will disproportionately impact certain sectors
While we expect headlines on tariff policy to be volatile near term, the longer-term impact from these policies will take time to play out, likely showing up in weaker corporate earnings and economic numbers later in the year. With the average tariff rate expected to be meaningfully higher, even assuming de-escalations with key trading partners, the adverse effect will disproportionately impact certain sectors and will weigh on individual issuers based on the geographical exposure of supply chains as well as companies’ pricing power and margins.
Although no sector is ultimately insulated from potential second-order effects should growth slow due to tariffs, the pockets of the IG market that are the most directly impacted are the following:
- Retailers are the most exposed sector in our view and are most likely to experience negative ripple effects, particularly fashion-oriented issuers that source a significant portion of products internationally.
- Autos also have significant direct impact, as they are capital-intensive businesses with margin headwinds already appearing and questionable ability to increase prices further.
- Within consumer products, certain companies have heavy exposure, including toy companies, appliance manufacturers, and recreational vehicle manufacturers.
As of 06/30/25. Source: J.P. Morgan, Voya IM.
Upgrades within IG market plus rising stars. Downgrades within IG market plus fallen angels.
Values may not sum to 100% due to rounding.
Sectors with modest or mixed exposure include:
- Food and beverage: While they’re better positioned than other consumer sectors, alcohol companies still face headwinds given expected aluminum tariffs on cans, and certain food companies could come under pressure if prices of raw material imports rise.
- Hardware: We believe that the impact of tariffs on hardware producers and technology distributors could be high given the global nature of supply chains, but the impact will be partially mitigated by companies’ ability to optimize their supply chains and pass costs onto their customers.
- Semiconductors: Most semiconductor companies using non-U.S. foundries will likely see a significant increase in their cost structure, but the impact may depend on where in the supply chain the tariff is implemented.
In contrast, sectors that are largely insulated are:
- Banks: There is no real direct impact due to tariffs, but key borrowers and earnings drivers may be partially impacted due to potential secondary effects.
- Insurance: Similar to banks, insurance companies are relatively defensive plays against tariffs, but inflationary impact could be a headwind to certain P&C insurers.
- Utilities: The domestic focus of the sector makes it one of the least exposed to tariffs.
In general, within the broad industry categories, we believe financials and utilities are better positioned to navigate any negative impacts stemming from potential trade wars. However, industrial companies do have options to limit the impact of tariffs somewhat: They can build local inventory ahead of tariffs, increase prices (though difficult against this consumer backdrop), negotiate with suppliers, lean into cost-saving or productivity efforts, or shift some production/sourcing to the U.S.
What we’re watching
Despite elevated policy uncertainty, the macro environment remains largely supportive for IG credit. Barring an unforeseen shock, spreads aren’t likely to move significantly wider in the near term. We expect U.S. growth to slow as policy uncertainty curbs corporate investment and higher tariffs reduce consumption, but tax cuts and deregulation have the ability to bring it back to potential. In addition, any downside to growth should be limited, as the Fed has the room to cut rates given the underlying downward trend in inflation, particularly if the labor market softens more than expected.
In our view, the main macro risk is any potential trade war that results in a more pronounced economic slowdown, which would put pressure on earnings and fundamentals. Other headwinds include rising geopolitical risk, which could create short-term swings within commodities and disrupt inflation expectations. In addition, the debt ceiling and spending will face increased scrutiny by bond investors, which could keep yields volatile. We would view any instances of spread widening as attractive entry points to add risk in the second half of the year, where strong technicals and still-solid fundamentals support valuations.