Key Takeaways
EM government bonds are trading relatively tight to US Treasuries overall, but this has been driven by investment grade sovereigns.
We see appealing stories in high yield countries where the macroeconomic direction of travel is positive, such as Ecuador.
With yields around 8% for the overall index and over 10% for high yield, the carry (gains made from bond income over time) available in EM looks attractive.
EM bonds have performed strongly despite negative perceptions, and the universe has become much more resilient to defaults and geopolitical crises.
 | The following content has been prepared by Allianz Global Investors GmbH (AllianzGI), and is reproduced with permission by Voya Investment Management (Voya IM). Certain information may be received from sources Voya IM considers reliable; Voya IM does not represent that such information is accurate or complete. Any opinions expressed herein are subject to change. Nothing contained herein should be construed as (i) an offer to buy any security or (ii) a recommendation as to the advisability of investing in, purchasing or selling any security. |
By Carlos Carranza, Portfolio Manager, Emerging Market Debt, Allianz Global Investors & Evangelia Pournara, Senior Product Specialist Fixed Income, Allianz Global Investors.
Fading hopes of multiple US rate cuts in 2024 would conventionally be seen as a negative for emerging market (EM) bonds. But spread levels and overall yields point to potential value in a maturing market that has become more resilient to defaults.
1. EM investment grade spreads are tight, but high yield spreads are not
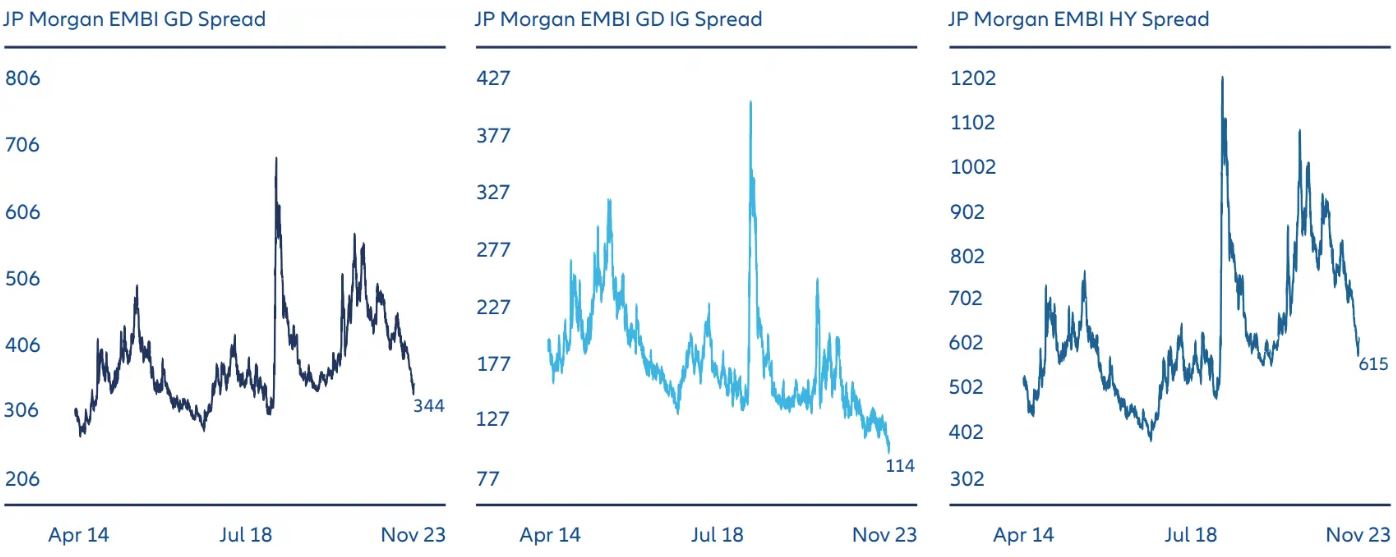
While the extra yield investors receive for holding EM government bonds over US Treasuries (the “spread”) overall has compressed over the last 12 months, it is important to look at this shift in the proper context.
As Exhibit 1 shows, most of this spread compression has taken place on investment grade (IG) rated EM sovereign issuers (middle chart), while high yield (HY) EM sovereign spreads are still some distance from previous tight levels. There is therefore further potential for spread compression in HY and we see relative value opportunities in several countries in the single-B rating bracket where the macroeconomic direction of travel is positive. One example would be Ecuador, where positive political developments are contributing to a solid economic story.

The JP Morgan EMBI Global Diversified Index (lhs) tracks liquid, USD emerging market bonds issued by sovereign and quasi-sovereign entities. EMBIGDIG (middle) and EMBIGDHY (rhs) reflect the constituents of the overall index rated investment grade and high yield respectively. Source: AllianzGI, Bloomberg, as of 16 April 2024.
2. Overall yields remain historically high
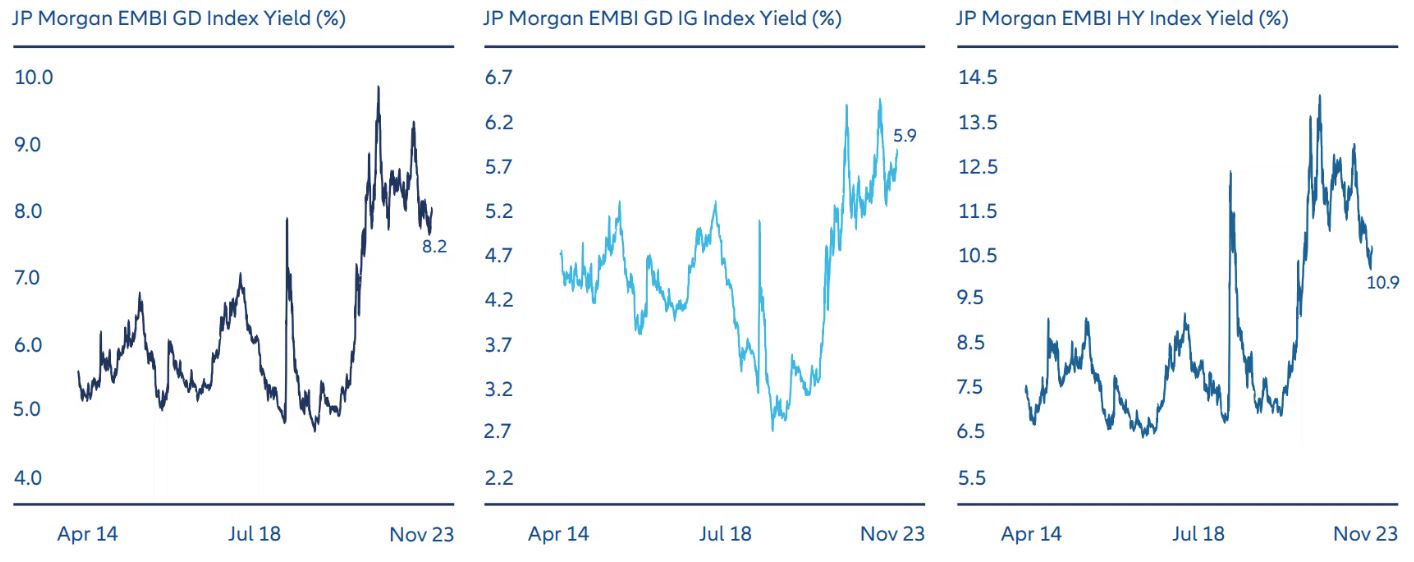
While EM spreads may have tightened, overall yields remain high relative to history (see Exhibit 2). The yield on the overall index (lhs chart) is at a sound 8%, with the high yield index (rhs chart) still above 10% despite the move lower in recent months. This high carry (gains made from bond income over time) boosts total return prospects and is an important driver of value in our view.

The JP Morgan EMBI Global Diversified Index (lhs) tracks liquid, USD emerging market bonds issued by sovereign and quasi-sovereign entities. EMBIGDIG (middle) and EMBIGDHY (rhs) reflect the constituents of the overall index rated investment grade and high yield respectively. Source: AllianzGI, Bloomberg, as of 16 April 2024.
3. EM bonds have performed strongly despite negative perceptions
In previous years the EM bond market would often suffer from contagion – one sovereign default or geopolitical flashpoint would spill over and affect valuations across the entire asset class – which made some investors wary.
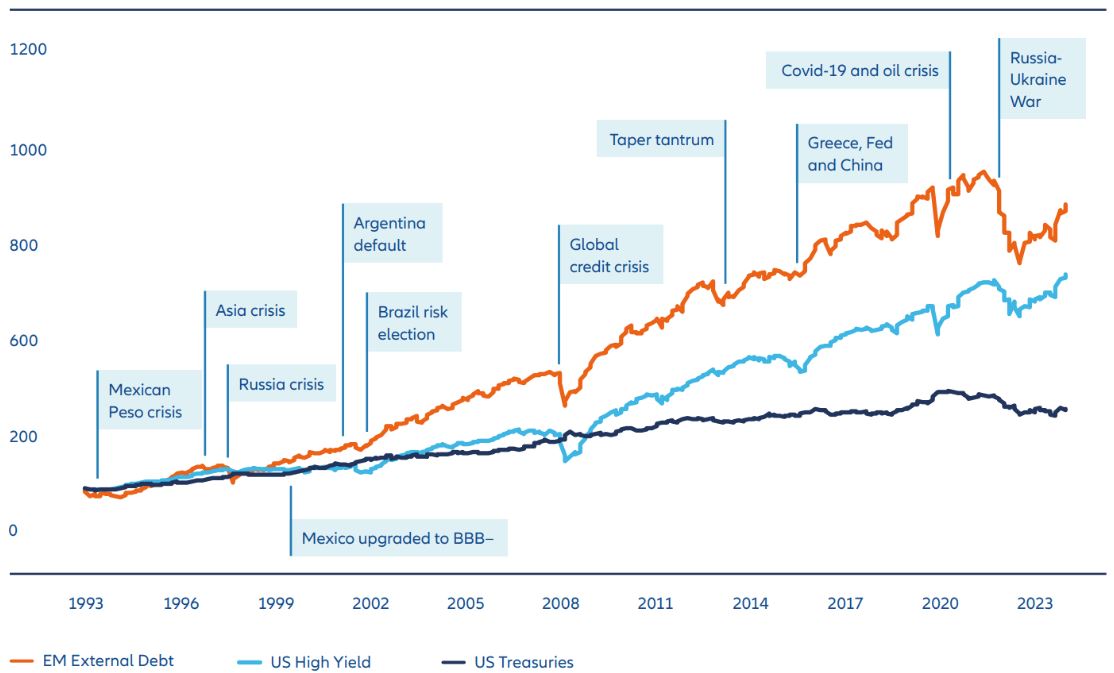
However, as Exhibit 3 shows, those shunning EM allocations would have missed out on potentially strong returns, which over time have outstripped more mainstream fixed income risk assets such as US high yield bonds.
Over the years contagion around EM defaults and geopolitical crises has become more contained. Today the universe is much larger and more diverse, meaning idiosyncratic issues in one or two countries don’t tend to lead to perceived higher default risk in others.
For this reason, we believe active management and careful credit analysis remains essential to avoid underperformers, which in our view is of equal importance to picking outperformers in EM.

Chart shows total return of JP Morgan EMBI Global Diversified Composite Index (JPEIDIVR Index), ICE BofA US Cash Pay High Yield Index and ICE BofA US Treasury Index, for a $100 Original Investment since 1993. EM External Debt = JPEIDIVR Index, US High Yield = J0A0 Index, US Treasuries = G0Q0 Index. Source: BofA Global Research, Bloomberg, JP Morgan EMBI Global Diversified Composite Index, ICE Data indices, LLC. Data as of March 2024. Past performance does not predict future returns.
